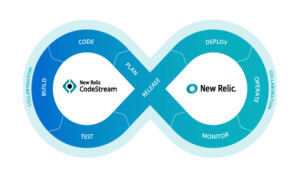
What is Codestream?
Improve performance through data-driven development.
Go from error discovery to resolution faster.
- Discover recent errors in the code you’re responsible for, right in the IDE.
- Step through the stack trace to locate the problem and collaboratively work towards a fix.
- Jump from errors inbox to the relevant code in your IDE with a click.
Search logs without context switching.
- Speed up your investigation by searching logs right from your IDE.
- Search for output from specific log lines in your code.
- Search logs reported by New Relic APM agents, infrastructure agent, or OpenTelemetry integration.
Get granular with code-level performance data.
- Quickly identify underperforming methods in your code to tackle problems early.
- Effortlessly monitor code performance with an always-on, in-editor view of metrics.
- Catch problems before production by viewing metrics for lower environments.
See the big picture; know how your services are performing.
- View golden metrics for your services—and any related services.
- Get actionable information on errors, vulnerabilities, and service-level objectives (SLOs).
- See telemetry for any instrumented environment.
- Fix errors, remediate vulnerabilities, and find non-compliant SLOs.


Look who
has us open.
has us open.
1
Only pay for what you need,
not a bundle of SKUs.
- Transparent user-based pricing
- 100 GB/month free data
- $0.30 per GB as you grow
- Start now for free


